
PANKAJ joshi
As a Data Analyst I unravel stories hidden in data to fuel informed strategies and drive meaningful outcomes
Technical Skills
SQL -Data types, Queries, Aggregate functions, Joins, Views, Window Functions, Subqueries, Recursive and Non Recursive CTEs, Stored Procedures
Power BI -Data Reporting, DAX, Data Modelling, Data Cleaning, ETL
MS Excel -Vlookup, Hlookup, Index and Match, Macros, Pivot Tables, Pivot Charts, MIS Reports, Count if, Sum if, Excel shortcuts
Python -Pandas, Numpy, Matplotlib, Seaborn
Typing -60 Words Per Minute
My Projects
power Bi + SQL
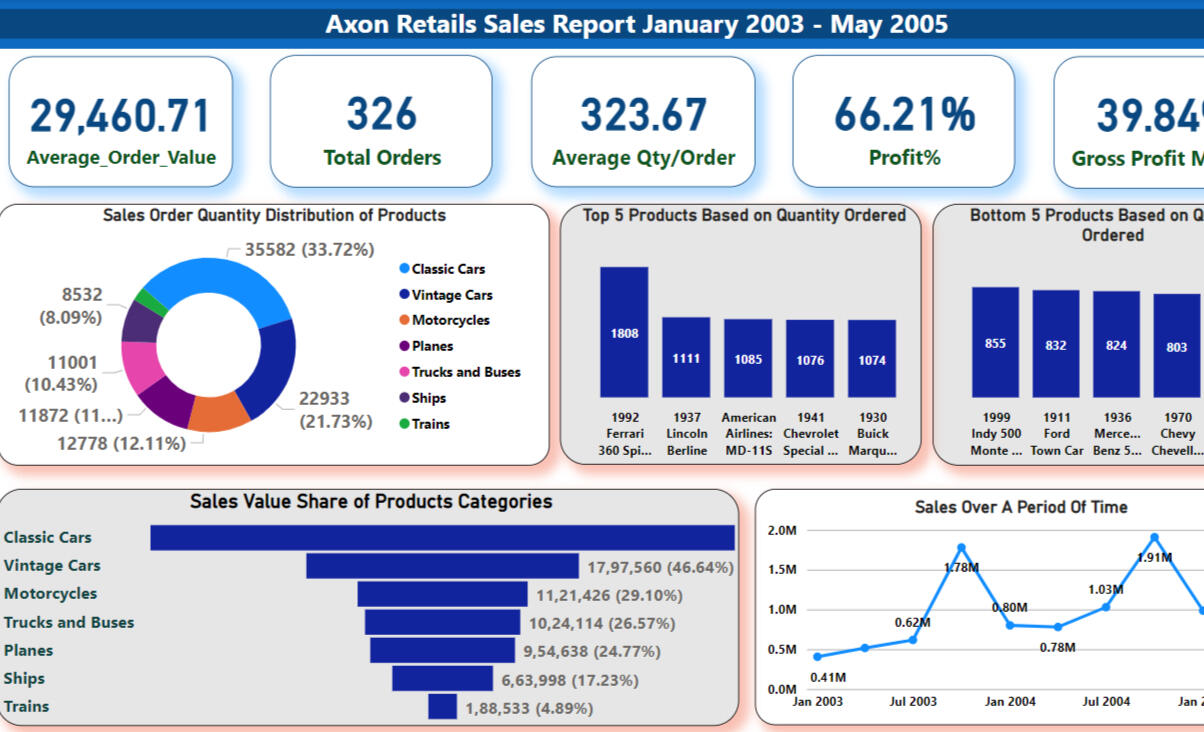
Axon Car Sales Analysis: Analyzed car sales data for Axon Car Retailer by developing an interactive sales dashboard using Power BI. I harnessed SQL queries to extract valuable insights from a diverse dataset, employing SELECT statements, aggregate functions, joins, and conditional statements to analyze user behavior and uncover meaningful patterns.
Objective Setting: Clearly defined objectives guided the analysis process.
Selection of Relevant KPIs: Identified KPIs aligned with company goals.
Utilization of Power BI and SQL: Leveraged Power BI for visualization and SQL for data ETL processes.
DAX Formulas in Power BI: Used DAX to derive new metrics for deeper insights.
SQL Queries: Extracted specific data for detailed analysis.
Sales Data Analysis: Identified trends, patterns, and areas for improvement.
Employee Performance Analysis: Evaluated individual and team contributions.
Customer Segmentation Analysis: Tailored strategies based on customer groups.
Monthly and Quarterly Assessments: Monitored progress and made adjustments.
Retrospective Study: Analyzed past performance to learn and improve.
Python
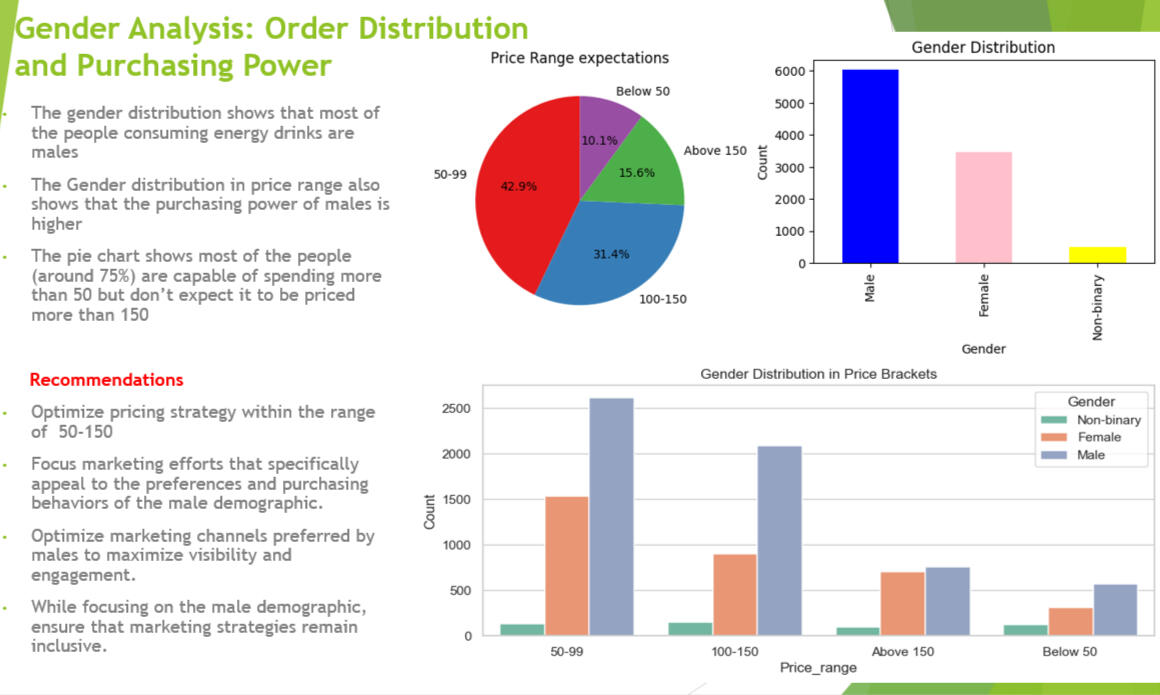
Energy Drink Analysis: Conducted in depth analysis of an energy drink launched by a Food and Beverage Company. Used Python with Pandas, Matplotlib, and Seaborn libraries for thorough data analysis. Uncovered key consumer preferences, purchase behaviors, and market trends in the energy drink sector.Provided actionable suggestions for marketing strategies, product enhancements, and market expansion opportunities.
Consumer Demographics: Identified key consumer groups.
Purchase Points: Recognized preferred sales channels.
Marketing Channels: Identified effective advertising platforms.
Product Preferences: Noted consumer choices.
Product Reception: Evaluated consumer satisfaction.
Geographical Insights: Highlighted market potential areas.
Consumption Situations: Tailored marketing strategies.
Price Sensitivity: Guided pricing strategies.
Healthier Options Demand: Addressed consumer preferences.
Python
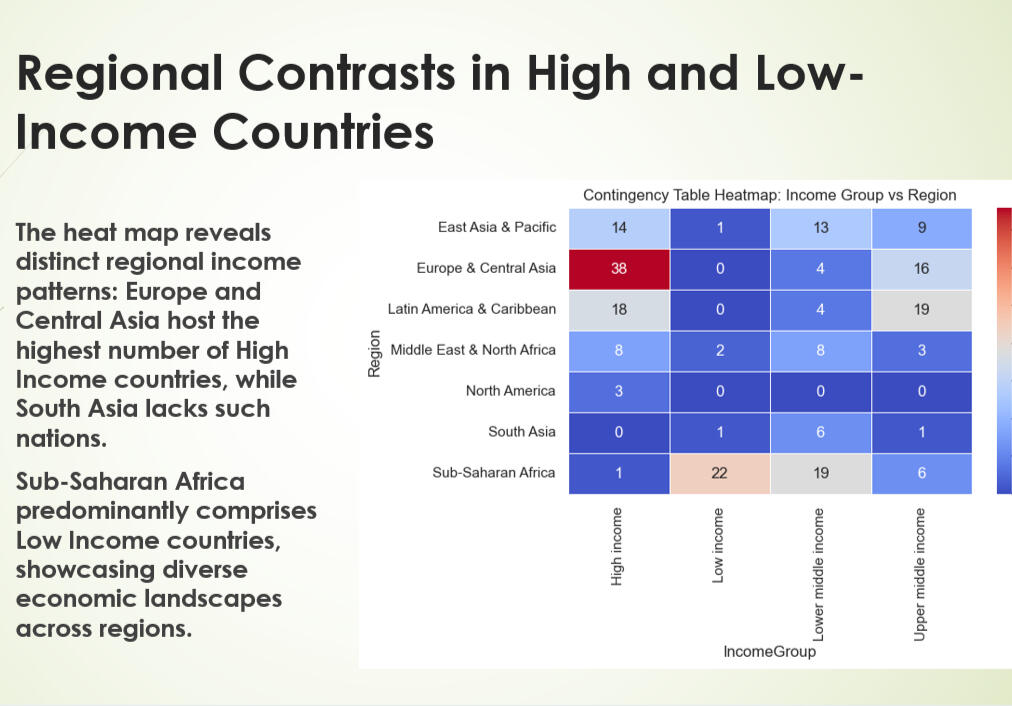
World Bank Population Data: Utilized Python with libraries like NumPy, Matplotlib, Seaborn, Pandas, and SciPy for in-depth analysis of World Bank population data. Identified global population growth trends, regional variations, and anomalies among countries.
Global Trends: Identified global population growth patterns.
Regional Disparities: Highlighted growth variations across regions.
Country Anomalies: Noted unusual trends in specific countries.
Income Group Analysis: Recognized populous groups like IDA and IBRD.
Historical Context: Compared population data over time for insights.
Reasons for Growth: Acknowledged economic, cultural, and policy factors.
Data Challenges: Managed complexity and volume of dataset.
Outlier Identification: Focused on trend analysis over time and employing z-scores for pattern recognition.
Power BI
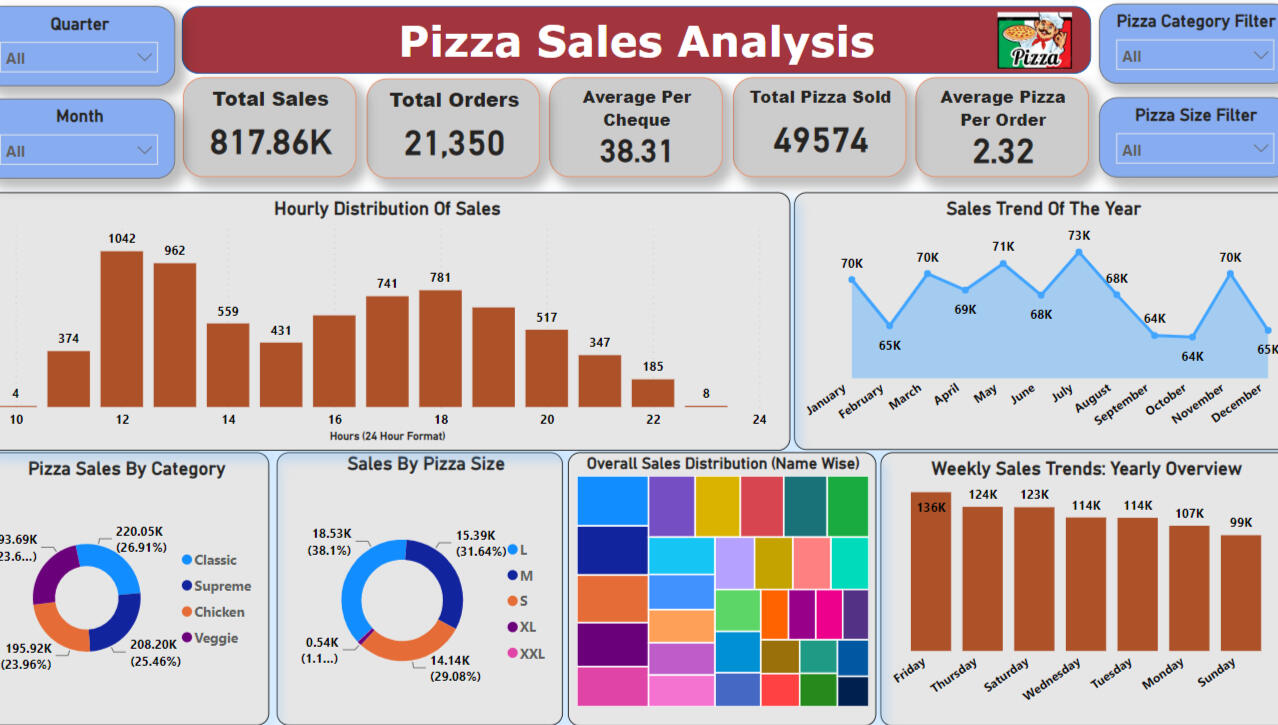
Pizza Sales Analysis: Utilized Power BI for in-depth analysis and visualization, and PowerPoint for comprehensive report presentation. Uncovered insights into sales trends, peak hours, pizza category performance, and factors affecting sales fluctuations. Provided actionable suggestions to address seasonal variations, menu adaptations, and promotional strategies based on analysis results.
Data Cleaning: Ensured data accuracy through effective cleaning techniques.
DAX Queries: Utilized DAX for efficient data manipulation.
Sales Trends: Identified peak hours and revenue patterns for decision-making.
Pizza Categories: Recognized performance variations for menu optimization.
Sales Factors: Analyzed seasonal shifts and anomalies for interventions.
Consumer Engagement: Evaluated metrics for understanding preferences.
Recommendations: Provided targeted suggestions for improvement.
Visualization: Used Power BI for clear data presentation.
Insight-driven Decisions: Emphasized data-driven strategies.
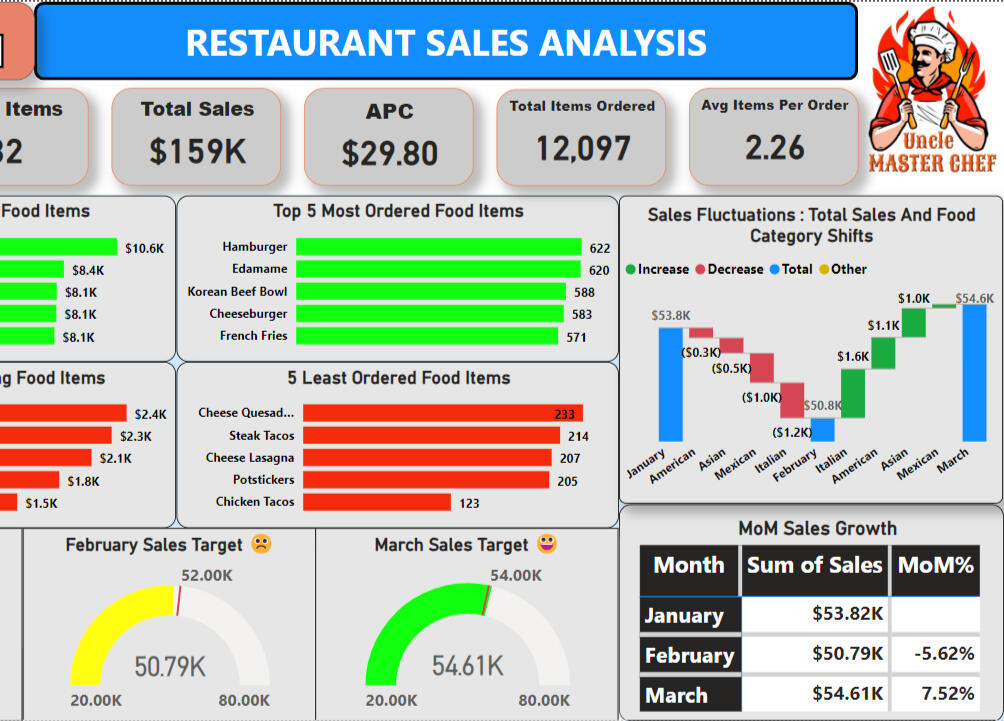
SQL + Power BI - Restaurant Sales Analysis
Data Sources: Collected restaurant orders and sales data from an online SQL database.
Initial Challenges: Created foreign keys to link tables and addressed mismatched records between tables.
SQL Analysis: Used SQL queries to extract meaningful information and ensure data accuracy.
Data Visualization: Exported data to Power BI for visualization and analysis.
Data Cleaning: Cleaned data in Power BI using DAX formulas and created new tables and columns.
Category-wise Sales: Analyzed sales distribution by food category.
Hourly Sales Distribution: Examined sales trends by hour of the day.
Sales Trends: Identified monthly sales peaks and dips.
Performance Metrics: Assessed top and bottom-performing items and categories.
Accuracy Check: Verified that SQL and Power BI results matched, ensuring reliable analysis.
Sales Performance: Analyzed 5,343 orders, $159,000 in sales, and an APC of $29.80. Top categories: Italian and Asian; top items: Korean Beef Bowl and Spaghetti & Meatballs; least popular: Chips & Guacamole and Potstickers.
Sales Trends: Peaks in early weeks and dips at month's end, especially in February. Highest sales on Mondays, peak hours around noon and evening.
Sales Targets: Missed targets in January and February, exceeded in March. Sales declined from January to February and rebounded in March, with notable fluctuations in Italian food.
Recommendations: Increase promotions during slow periods, target less popular items, optimize the menu, ensure peak-time staffing, and gather customer feedback.
Certifications